Abstract
The Unmanned Aerial Vehicle (UAV) industry is reaching a level of maturity where its progress is now enabling a different kind of transportation altogether. Companies like Boeing, UBER, Lillium, Airbus and many more are investing millions into urban friendly VTOL solutions. This means that in the not too distant future, commuters can get on pods for a 30-minute flight to work; avoiding traffic congested roads.
Watfly is the University of Waterloo’s student design team, that is working on breaking the technical boundaries which currently hinder this new mode of transport. The analysis done here will ultimately be used to compete in the GoFly competition sponsored by Boeing and other aerospace companies.
Case Study
One of the main technical challenges with urban air transport is propulsion. Due to the precise controllability of an electric powertrain, a propeller is the primary source of lift for most VTOL aircrafts. Accurate modelling and prediction of a propeller’s thrust capacity is crucial in shortening development times and achieving a quiet, yet functional propeller.
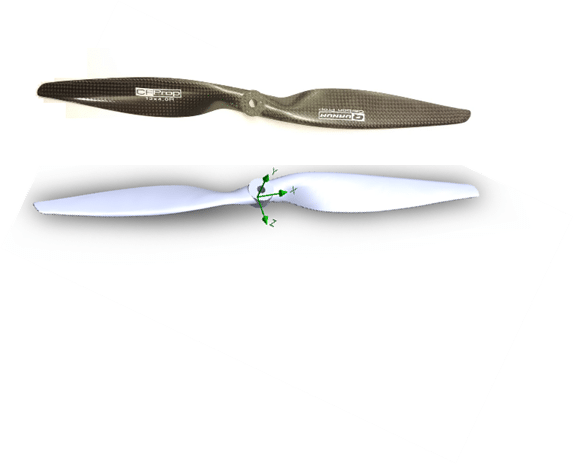
The propeller under consideration here is a 13 X 4 high lift Quanum Carbon fiber propeller. Unfortunately, propeller manufacturers seldom release CAD data for the required analysis, burdening researchers and engineers. Thanks to the team at Proto3000, and their ability to accurately scan complex geometries, the propeller was digitized with ease. The high gloss surfaces of composite components are usually a consistent problem which the Creaform Optical CMM handled with ease.
Analysis
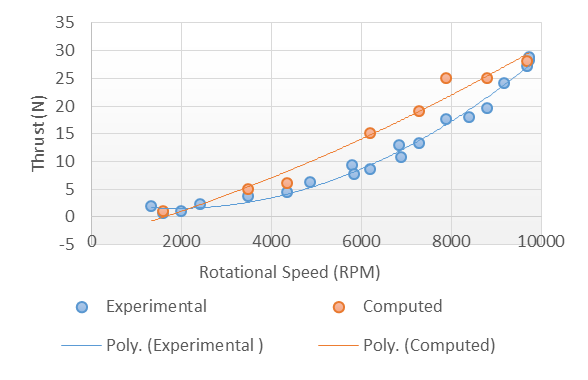
A moving reference frame was used to model the propeller given the limited computational resources required in comparison with techniques such as the sliding mesh approach. The computation was also done through a range of 1600 – 9700 rpm, for which empirical data was also derived using a contactless tachometer and a thrust gauge. The chosen RPM range was limited based on the operational limits of the tachometer, however, this RPM range satisfies most use cases for such propellers.
Outcome
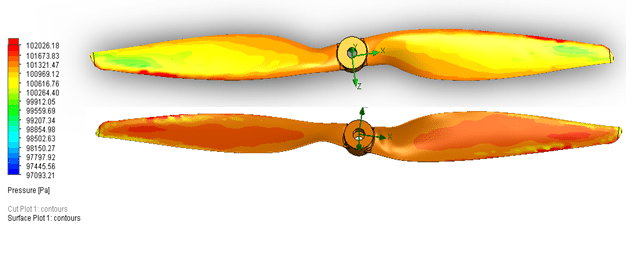
It can clearly be seen that the CFD results (refer to figures below) over-predicted this propeller’s thrust capacity across most of the analyzed RPM range. A majority of this discrepancy can be attributed to experimental set up error, and the inlet condition variation between experimental and computed results. An average error of 27% was seen, while this is appears quite high, the maximum magnitude delta was 7.3 N or in more relatable terms roughly 1 kgf.
Looking for Reverse Engineering Services?
Work with our 3D scanning team for comprehensive on-site, or in-house data capture